# Artificial Text Detection
This project is based on my Master's thesis:
> **"Алгоритм выявления искусственно созданных текстов"**
> Nizhny Novgorod State Technical University, 2021
> Author: Andrey Kuznetsov
It is a C++/Qt-based application designed to detect artificially generated
scientific texts (e.g., SCIgen outputs). The detection method is based on
analyzing the internal stylistic consistency of the document using unsupervised
clustering and rank correlation metrics.
 ## Project Overview
The program processes input text, splits it into fragments, builds a vector
space using N-gram features, computes a pairwise distance matrix using
Spearman rank correlation, and applies clustering to detect stylistic
discontinuities. Such discontinuities are often present in machine-generated
texts.
## Technologies Used
- **C++17**
- **Qt 5 (Widgets, Charts, QThread)**
- **Boost Libraries**:
- `boost::python` and `boost::python::numpy` for C++/Python bridge
- **Python 3**
- `numpy`, `scikit-learn`, `scikit-learn-extra`
## Features
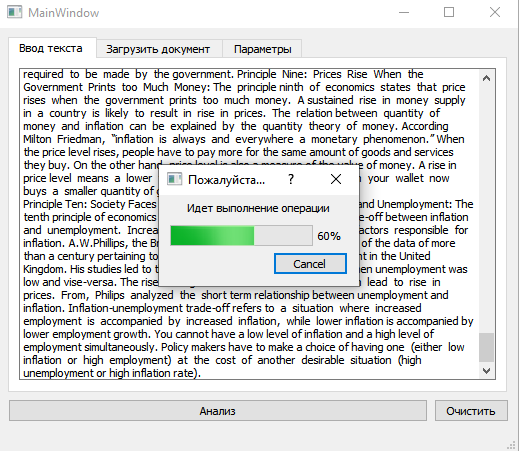
- **Flexible Text Input**
- Manual text input via editor
- File selection via file dialog
- **Drag and drop** support for `.txt` files
- **Text Preprocessing**
- Removes stop words, non-letter symbols, repeated spaces
- Converts to lowercase
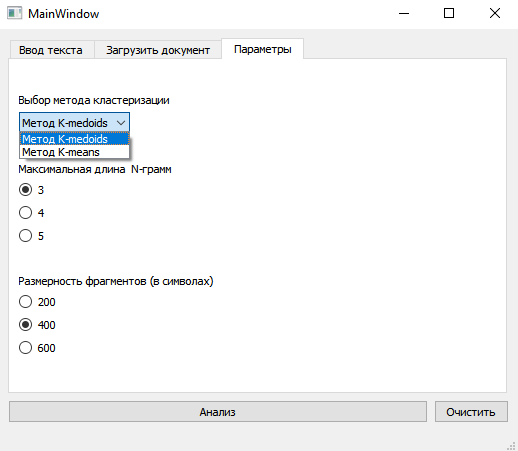
- **N-Gram Extraction and Dictionary Building**
- Extracts N-grams (min N=2; max N set via UI)
- Builds global dictionary from fragments
- Performs percentile-based feature selection
- **Vector Space Model Construction**
- Vectorizes fragments based on N-gram frequencies
- Computes document-fragment-feature structure: `vector>>`
- **Distance Calculation Using Rank Correlation**
- Calculates pairwise distance matrix between fragments using **Spearman correlation**
- Computes average rank dependence (`ZVT`) using windowed comparisons
- **Matrix Normalization**
- Normalizes matrix shape by padding with zeros for clustering
- **Unsupervised Clustering with Python**
- Supports: **K-Medoids**, **K-Means**, **Agglomerative Clustering**
- Clustering is performed using Python (`scikit-learn`, `scikit-learn-extra`)
- Data exchange is handled via `Boost.Python` + `Boost.NumPy`
- **C++ ⇄ Python Integration**
- Converts C++ matrix to Python `numpy.ndarray`
- Calls clustering methods from Python module `mymodule.py`
- Extracts prediction labels back into C++
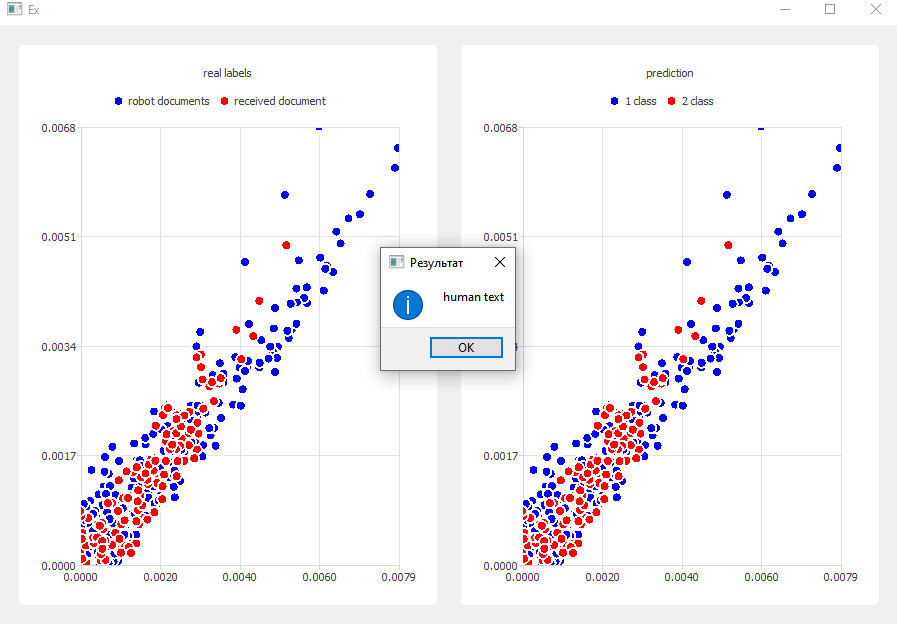
- **Visual Output**
- Scatter charts for predicted vs. real document labels
- Color-coded clusters in real-time UI
- **Multithreaded Execution with Progress Bar**
- GUI remains responsive via `QThread`
- Shows status using `QProgressDialog`
## Algorithm Pipeline (Detailed)
1. **Text Input**
- User provides text via input box, file dialog, or drag-and-drop.
- Text is stored in `target_doc`.
2. **Preprocessing** (`prepare()`)
- Removes stop words (prepositions, conjunctions, etc.)
- Removes all characters except letters and spaces
- Removes repeated characters (e.g., spaces)
- Converts text to lowercase
3. **Fragmentation**
- Text is split into equal-length chunks based on UI parameters
4. **N-Gram Extraction**
- Combines all documents into a single corpus
- Calculates N-grams for N from 2 up to max N (from UI)
- Uses a sliding window algorithm
- Aggregates results into a dictionary
5. **N-Gram Filtering**
- Selects N-grams above 90th percentile of frequency
- Saves filtered list to a text file
6. **Vector Space Modeling**
- For each document, for each fragment:
- Computes vector of N-gram frequencies via `freq_in_chunk()`
- Produces nested structure of frequency vectors
7. **Rank Correlation (Spearman's rho)**
- Calculates rank correlation distance between fragment vectors:
ρ = 1 - (6 * ∑ d_i^2) / (n(n^2 - 1))
- Implemented via `zv_calc()` and `correlation()`
8. **Average Rank Dependence**
- Computes `ZVT` values for each fragment (based on 10 previous)
- Combines `ZVT` into full pairwise distance matrix
9. **Matrix Padding**
- Matrix may have uneven rows; padded with zeros to square shape
10. **C++ to Python Transfer**
- Converts distance matrix to NumPy arrays using `Boost.NumPy`
- Initializes embedded Python interpreter
- Calls `mymodule.py::{kmedoids, kmeans, agglClus}`
- Extracts prediction results
11. **Post-Processing Results**
- Splits results into clusters for artificial vs. input document
- Compares distributions:
- If both match → **Artificial text**
- If different → **Human-written text**
12. **Visualization & UI**
- Result shown in message box
- Prediction charts drawn with `QChartView`
## Project Overview
The program processes input text, splits it into fragments, builds a vector
space using N-gram features, computes a pairwise distance matrix using
Spearman rank correlation, and applies clustering to detect stylistic
discontinuities. Such discontinuities are often present in machine-generated
texts.
## Technologies Used
- **C++17**
- **Qt 5 (Widgets, Charts, QThread)**
- **Boost Libraries**:
- `boost::python` and `boost::python::numpy` for C++/Python bridge
- **Python 3**
- `numpy`, `scikit-learn`, `scikit-learn-extra`
## Features
- **Flexible Text Input**
- Manual text input via editor
- File selection via file dialog
- **Drag and drop** support for `.txt` files
- **Text Preprocessing**
- Removes stop words, non-letter symbols, repeated spaces
- Converts to lowercase
- **N-Gram Extraction and Dictionary Building**
- Extracts N-grams (min N=2; max N set via UI)
- Builds global dictionary from fragments
- Performs percentile-based feature selection
- **Vector Space Model Construction**
- Vectorizes fragments based on N-gram frequencies
- Computes document-fragment-feature structure: `vector>>`
- **Distance Calculation Using Rank Correlation**
- Calculates pairwise distance matrix between fragments using **Spearman correlation**
- Computes average rank dependence (`ZVT`) using windowed comparisons
- **Matrix Normalization**
- Normalizes matrix shape by padding with zeros for clustering
- **Unsupervised Clustering with Python**
- Supports: **K-Medoids**, **K-Means**, **Agglomerative Clustering**
- Clustering is performed using Python (`scikit-learn`, `scikit-learn-extra`)
- Data exchange is handled via `Boost.Python` + `Boost.NumPy`
- **C++ ⇄ Python Integration**
- Converts C++ matrix to Python `numpy.ndarray`
- Calls clustering methods from Python module `mymodule.py`
- Extracts prediction labels back into C++
- **Visual Output**
- Scatter charts for predicted vs. real document labels
- Color-coded clusters in real-time UI
- **Multithreaded Execution with Progress Bar**
- GUI remains responsive via `QThread`
- Shows status using `QProgressDialog`
## Algorithm Pipeline (Detailed)
1. **Text Input**
- User provides text via input box, file dialog, or drag-and-drop.
- Text is stored in `target_doc`.
2. **Preprocessing** (`prepare()`)
- Removes stop words (prepositions, conjunctions, etc.)
- Removes all characters except letters and spaces
- Removes repeated characters (e.g., spaces)
- Converts text to lowercase
3. **Fragmentation**
- Text is split into equal-length chunks based on UI parameters
4. **N-Gram Extraction**
- Combines all documents into a single corpus
- Calculates N-grams for N from 2 up to max N (from UI)
- Uses a sliding window algorithm
- Aggregates results into a dictionary
5. **N-Gram Filtering**
- Selects N-grams above 90th percentile of frequency
- Saves filtered list to a text file
6. **Vector Space Modeling**
- For each document, for each fragment:
- Computes vector of N-gram frequencies via `freq_in_chunk()`
- Produces nested structure of frequency vectors
7. **Rank Correlation (Spearman's rho)**
- Calculates rank correlation distance between fragment vectors:
ρ = 1 - (6 * ∑ d_i^2) / (n(n^2 - 1))
- Implemented via `zv_calc()` and `correlation()`
8. **Average Rank Dependence**
- Computes `ZVT` values for each fragment (based on 10 previous)
- Combines `ZVT` into full pairwise distance matrix
9. **Matrix Padding**
- Matrix may have uneven rows; padded with zeros to square shape
10. **C++ to Python Transfer**
- Converts distance matrix to NumPy arrays using `Boost.NumPy`
- Initializes embedded Python interpreter
- Calls `mymodule.py::{kmedoids, kmeans, agglClus}`
- Extracts prediction results
11. **Post-Processing Results**
- Splits results into clusters for artificial vs. input document
- Compares distributions:
- If both match → **Artificial text**
- If different → **Human-written text**
12. **Visualization & UI**
- Result shown in message box
- Prediction charts drawn with `QChartView`